Diagnosis Tool for Engine Control Units
Usually, diagnosis and service tools for engine control units
(ECU) are managed by very specialized, thus high-priced hardware diagnosis
boxes. The described application 'STEYR_diag', developed originally in LabVIEW™
6i, can achieve the same job with all features required by the automotive
industry. All that is needed is a simple PC (usually a notebook).
The major milestone was to distinguish the user level (from simple user to test
bench engineer) to adapt the user interface and available options. The basic
features, which are described below in more detail, are: automatically find port
and ECU, monitoring and displaying data, monitoring and clearing errors,
calibration of engine instruments, and logging data.
Program Features
'STEYR_diag' is a 32 bit Windows application that requires an operating
system Microsoft® Windows® 95B or higher. Processor speed should be at least
166 MHz, with 32 MB Ram and 20 MB free disc space. After automatically
installing the LabVIEW™ runtime engine, the main program is installed. An
initialization file, where each change of settings is stored, is created at
first run.
Due to the outdoor surroundings of possible places of action, each function can
be carried out just by hitting certain keys, no mouse is necessary. This is
especially useful, e.g., for checking boat engines aboard.
The following features are available in the main window.
Monitoring and recording
Various data like engine speed, oil temperature, booster pressure, etc. are
provided by the ECU. The data can be freely selected from the user interface and
are displayed as digital values and/or graphical instruments. The data can be
recorded with high sample rate and stored in a text-based format for further
evaluation. One x-axis as well as several y-axes can be selected for display in
a preview (XY graph). A special algorithm prevents from overwriting data
accidentally.
By pressing the 'Graphic' button in the main window, the display of a virtual
dashboard appears, see figure 1.
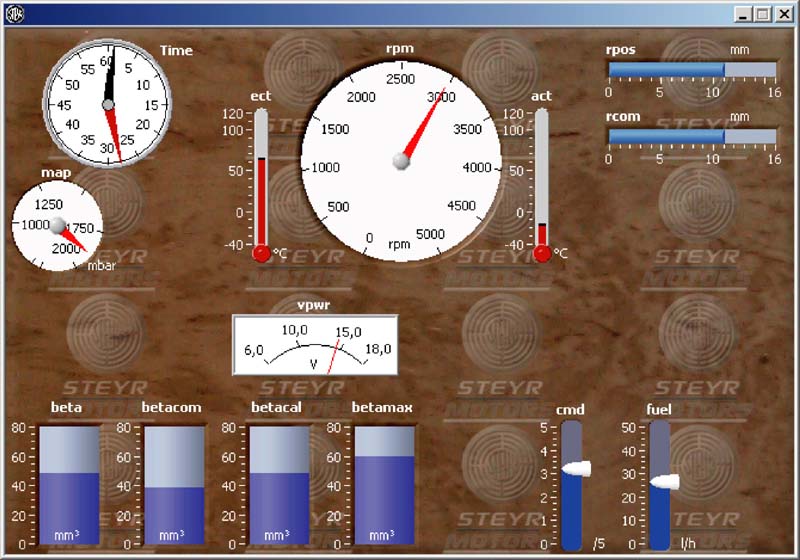
Figure 1 Virtual dash board in 'STEYR_diag'
Moving the cursor over the various instruments causes the popping up of tip
strips with additional information. The gauge will be displayed at the virtual
dashboard only if the corresponding channel is selected.
Showing errors stored in the ECU and clearing them
After entering the error handling subroutine, the window shown in figure 2
appears. The sample rate is lower. The error frame at the right bottom shows the
current errors which are listed, consisting of error code, error number, and the
reason/solution part. Different colors emphasize whether the error is obsolete
or actual.
On the left of the error frame there are check boxes for selecting and
deselecting a specific error. It is possible to trace one particular active
error; in this case a sound is generated while the program permanently tries to
clear the error. This is a useful tool as it allows to check cables or
connections at the engine until the sound is off.
The contents of the user interface will change according to
the selected program feature. However, the following information is found in
each subroutine window:
-On the bottom left of the frame in figure 2, the selected channels are shown,
-Additional information about the respective ECU, which is shown on the top
right,
-Information about the torque limiter can also be found in the main window.
The number of the function keys and their allocation on the top left is of
course depending on the subroutine.

Figure 2 Window of the error subroutine of 'STEYR_diag'
Loading several parameters
Parameters like user level, communication features, ECU memory addresses, etc.
are loaded from a file. The ECU memory addresses are encrypted. The parameter
file is secured by a special algorithm, which makes the file invalid as soon as
it was tampered.
Calibration of engine instruments
This submenu is for the calibration of speedometer, thermometer, and idle speed.
In this routine, an instruction message for further procedure pops up
corresponding to the respective selected instrument.
Automatically finding the interface and the type of the ECU
The connection of the ECU is established by an ISO-K / RS232 interface. The port
of the PC is found automatically as is the type of the ECU. This information is
shown on the top right corner.
Demo mode
If no ECU was detected during initialization of the program, the user can run a
demonstration to check out all features of the software. A prepared data set is
displayed with full functionality. So, clearing of errors, setting instruments,
logging, etc. can be evaluated.
User level
A rather broad spectrum of people with different knowledge and qualifications
are expected to use this program. They will consist, for example, of developers,
test bench engineers, sales persons, end-clients. Therefore, it is necessary to
provide different user authorizations to alter and operate this application for
these different levels.
Users with low authorization, e.g., will just have to start and stop data
logging. Selection of channels, storing location, file name, and so on, are
provided automatically. An engineer unlike, has the additional possibility to
select channels from a large pool. This person can select the sample rate as
well as preview of the data using various x-, and y-axis. Furthermore, the
supply of menu entries at higher user level is much larger. It may be forced a
certain port or ECU type to avoid time delay while automatically search or
specify file paths to easily run multiple configurations. It is also possible to
alter connection failure tolerance to run at higher sample rate.
However, menu options like selection of language or unit are available at all
levels. Since M1-engines are sold nearly all over the world, this feature is a
courtesy to the customer and sales representatives.
Conclusion
The easy-to-use, self-explaining design ensures a timesaving and hence
cost-effective diagnostics. A high flexibility of this tool can be reached with
LabVIEW™. It can be applied for all kinds of M1-engine types and at different
user levels from end customers up to developers. All this results in operational
safety and a simple, low-cost maintenance. In addition, features like safety
routines secure from unauthorized manipulation make it a powerful service und
client tool.